

Marc Adler
March 2022
Introduction
This document shows how you can do local development in .NET Core with Prometheus and Grafana for instrumentation. Using this document, you can run both Prometheus and Grafana locally (I use a MacBook Pro). In addition, you can deploy either or both tools in separate Docker containers.
Prometheus
Download Prometheus. Extract the compressed TAR file and move the folder into another directory.
Change the prometheus.yml configuration file. At the bottom of the file is the scrape targets. Change the URL (and the port) to where the .NET application is going to be publishing its metrics. For example, if the .NET app is publishing to port 9934 using the KestrelMetricServer, then change the target to localhost:9934.
| scrape_configs: # The job name is added as a label `job=<job_name>` to any timeseries scraped from this config. – job_name: “prometheus” # metrics_path defaults to ‘/metrics’ # scheme defaults to ‘http’. static_configs: – targets: [“localhost:9934”] <- Change it here |
Start Prometheus by running the command:
| ./prometheus –config.file=”prometheus.yml” |
Grafana
Download Grafana and extract the compressed TAR file and move the folder into another directory.
Go to the Grafana folder and run the command:
| ./bin/grafana-server web |
The .NET Core Application
Let’s assume that we have a .NET Core application. We can initialize Prometheus using the first three statements below. Assume that the .NET application is outputting some custom counters on localhost:9934. We also have some helper functions that will output data to a Prometheus counter.
We use two NuGet packages: prometheus-net and prometheus-net.AspNetCore.
using Prometheus; |
We can get the metrics by going into Postman or Chrome and navigating to http://localhost:9934/metrics.
| # HELP ServiceHeartbeats Heartbeat Counter # TYPE ServiceHeartbeats counter ServiceHeartbeats{Service=”OMSService”} 30 ServiceHeartbeats{Service=”ExecutionService”} 20 ServiceHeartbeats{Service=”XPTreasuryServiceManager”} 60 ServiceHeartbeats{Service=”OrderRepositoryService”} 30 |
You can also get the metrics for Prometheus itself by using port 9090.
Now we will set up Grafana to display the metrics. In Chrome, go to localhost:3000. Use the credentials admin/admin.
Let’s add a new Prometheus data source to Grafana by navigating to http://localhost:3000/datasources
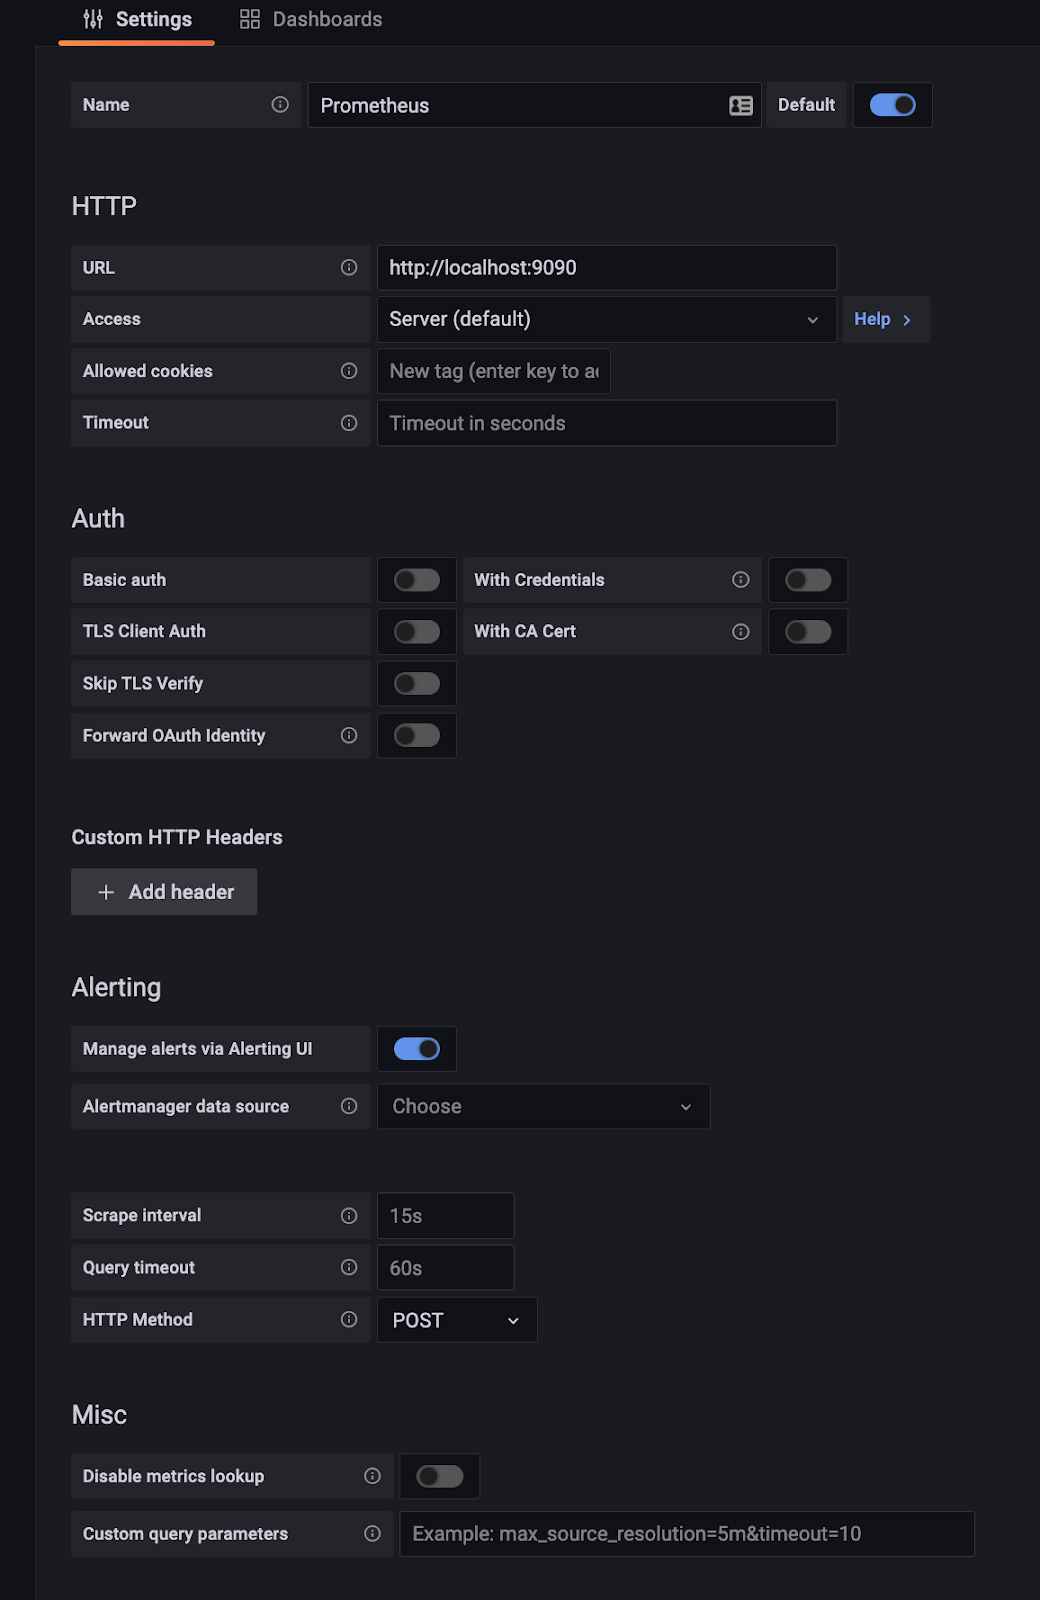
The URL for the data source should be http://localhost:9090.
Now we can find the metrics that our .NET application emitted.

Here is a simple counter graphed with Grafana.

Prometheus and Docker
Instead of running Prometheus as a local process, we can load it into Docker and run it. The directions on DockerHub tell you how you can use your own prometheus.yml configuration file.
Important: Since the .NET application is not running inside of the same Docker container as Prometheus, in the prometheus.yml file, you need to substitute localhost with host.docker.internal.
| scrape_configs: # The job name is added as a label `job=<job_name>` to any timeseries scraped from this config. – job_name: “XP Voyager” # metrics_path defaults to ‘/metrics’ # scheme defaults to ‘http’. static_configs: – targets: [“host.docker.internal:9934”] |
And run the Docker container like this:
| docker run –name xp-voyager-prometheus -d -p 9090:9090 -p 9934:9934 -v “/home/magmasystems/Projects/XP.Treasury.Voyager/prometheus/prometheus.yml:/etc/prometheus/prometheus.yml” prom/prometheus |
Notice that, in the volume argument, you need to use the absolute pathname of the prometheus.yml source file.
Grafana and Docker
To run Grafana as a Docker container:
| docker run –name grafana -d -p 3000:3000 grafana/grafana |
When you set up the Prometheus data source, remember to use http://host.docker.internal:9090 as the Prometheus URL if your Prometheus is also running inside of Docker.